
Monitoring with Foglight
This post is a summary of how to setup monitoring of individual resources (like databases) with the Foglight monitoring system.
Table of Contents
Monitoring of Oracle Databases
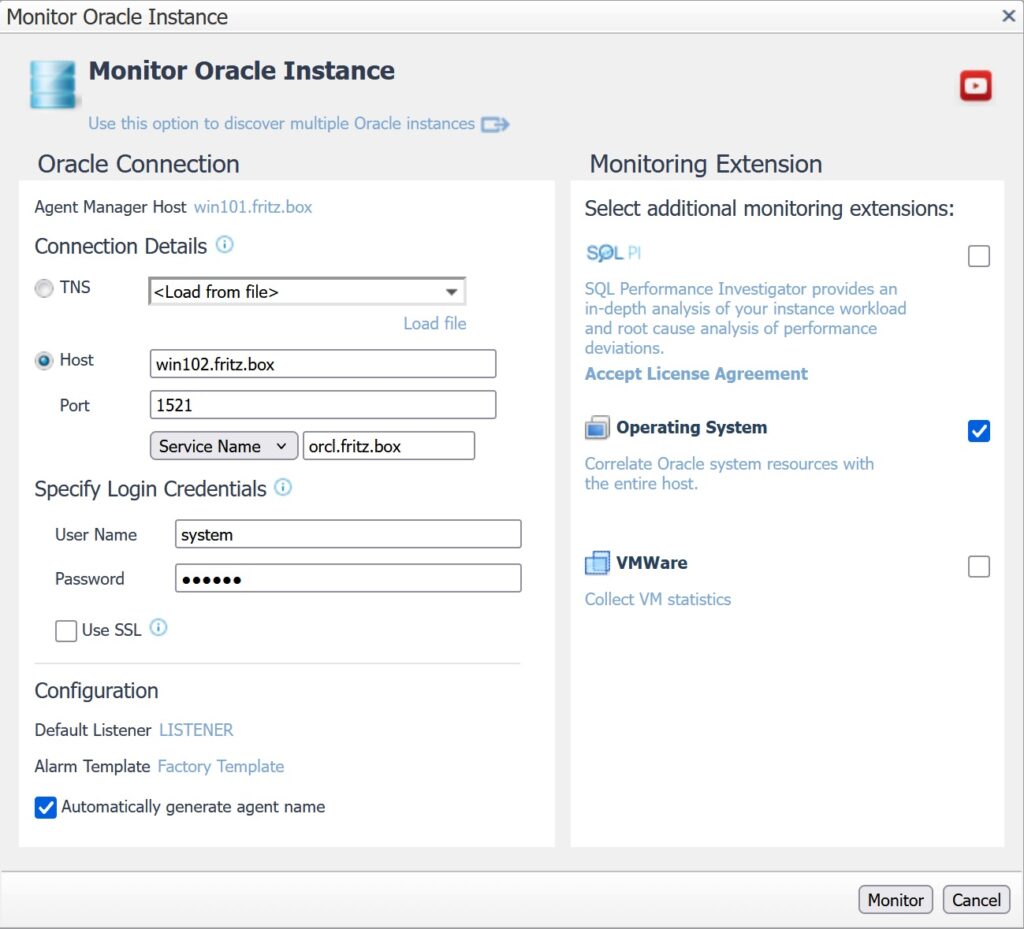
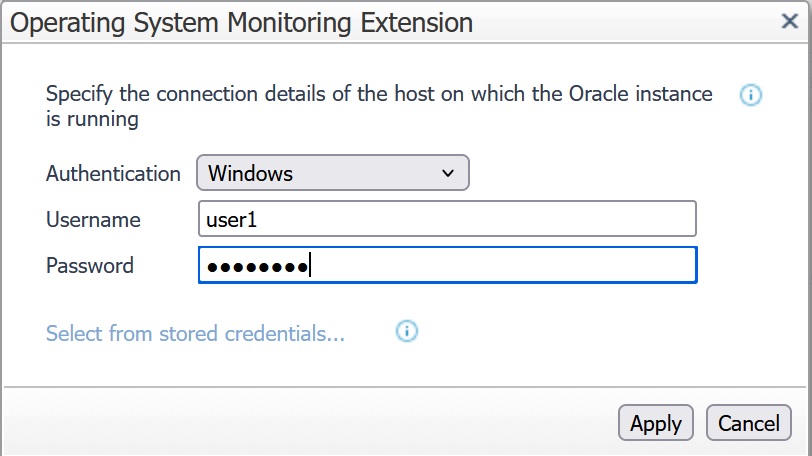
In the Foglight Dashboard we go to Databases, click on +Monitor and select Oracle. We enter the data to connect to the database from the Foglight server, and we specify the OS credentials of the monitored host:
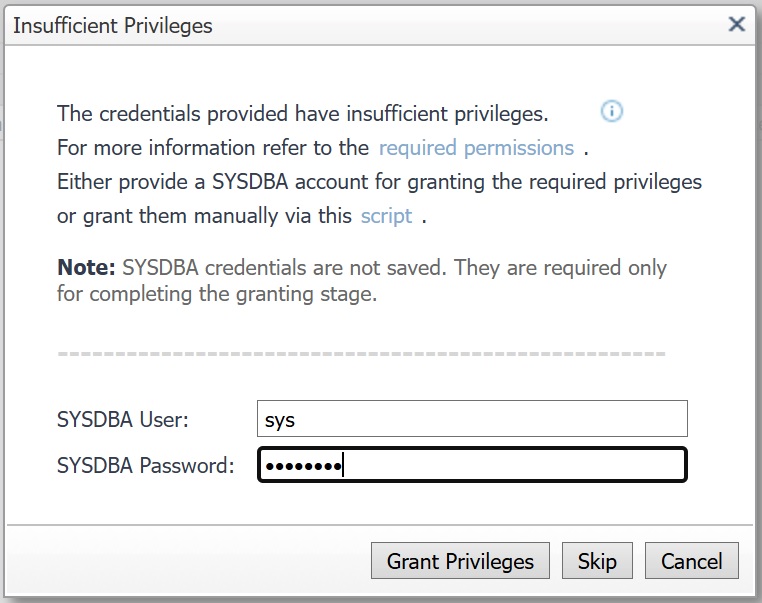
The first time we add a database to Foglight, the sys user needs to grant privileges to the monitoring user (system):
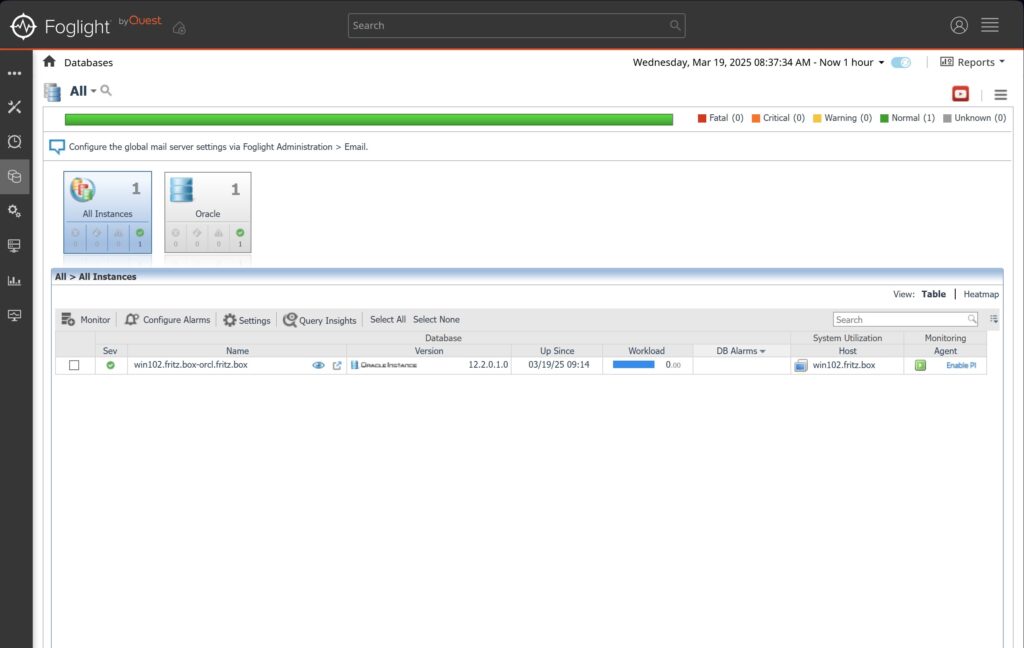
After some time we can see that the Oracle Database Agent sends monitoring data:
Note on Oracle Databases running on Windows Server 2008 R2
Windows Server 2008 R2 is not a supported OS for monitoring with the Foglight Agent Manager 7.3. We get errors like:
- DBO_Usability Failed with the exception: A command shell connection could not be established.
- Agent “Monitor@WIN2” (id: 17) is broken (health state: “Broken”). Please check agent logs.
- Or when accessing the Oracle Alert Log: An error occurred while trying to retrieve data to this screen. If this issue persists, contact Quest Software Support.
- A command shell connection could not be established
These errors can be fixed by running the tasks in this document and adding a rule to the Windows firewall on the monitored host to allow incoming RPC traffic from the Foglight server (11.1.1.171 in my case):
netsh advfirewall firewall add rule name="Foglight RPC" dir=in action=allow protocol=TCP localport="RPC" remoteip=11.1.1.171
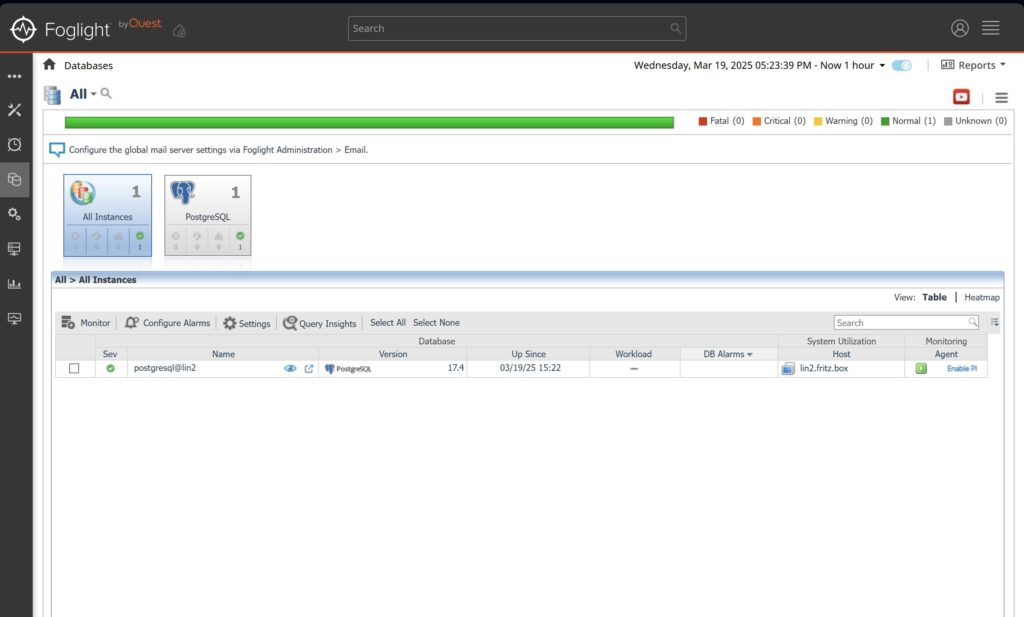
Monitoring of PostgreSQL Databases
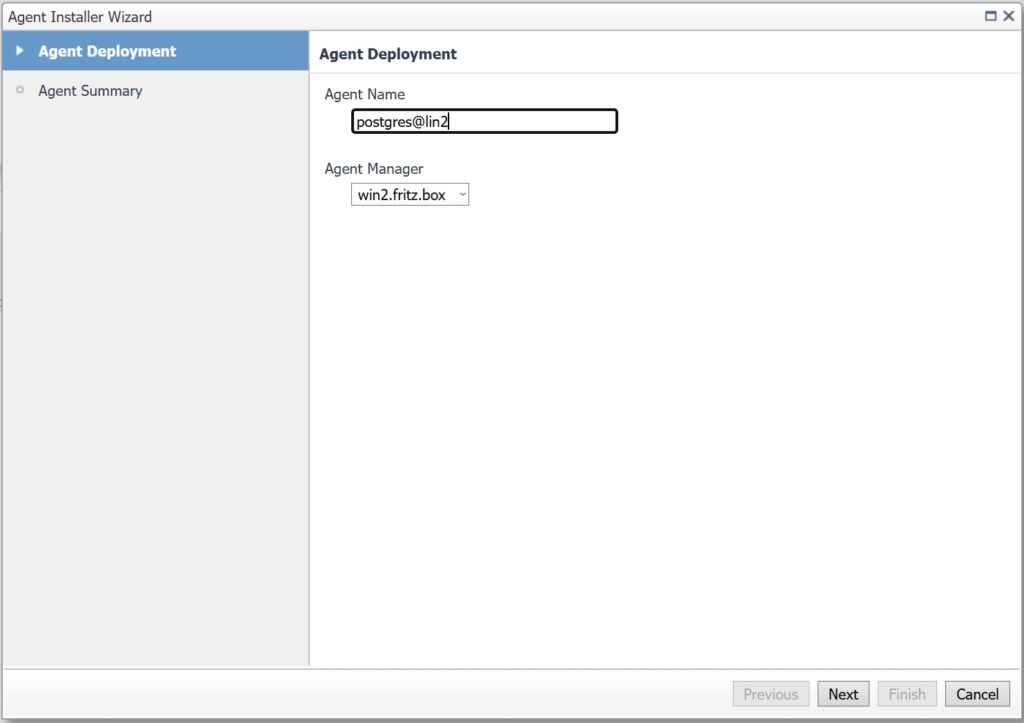
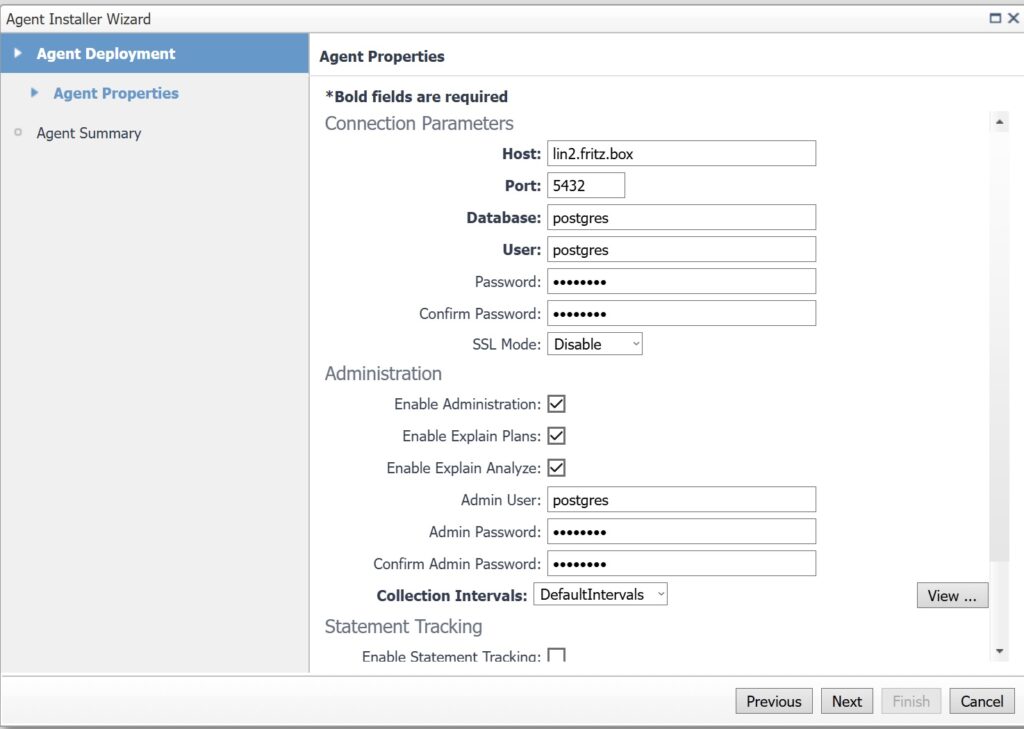
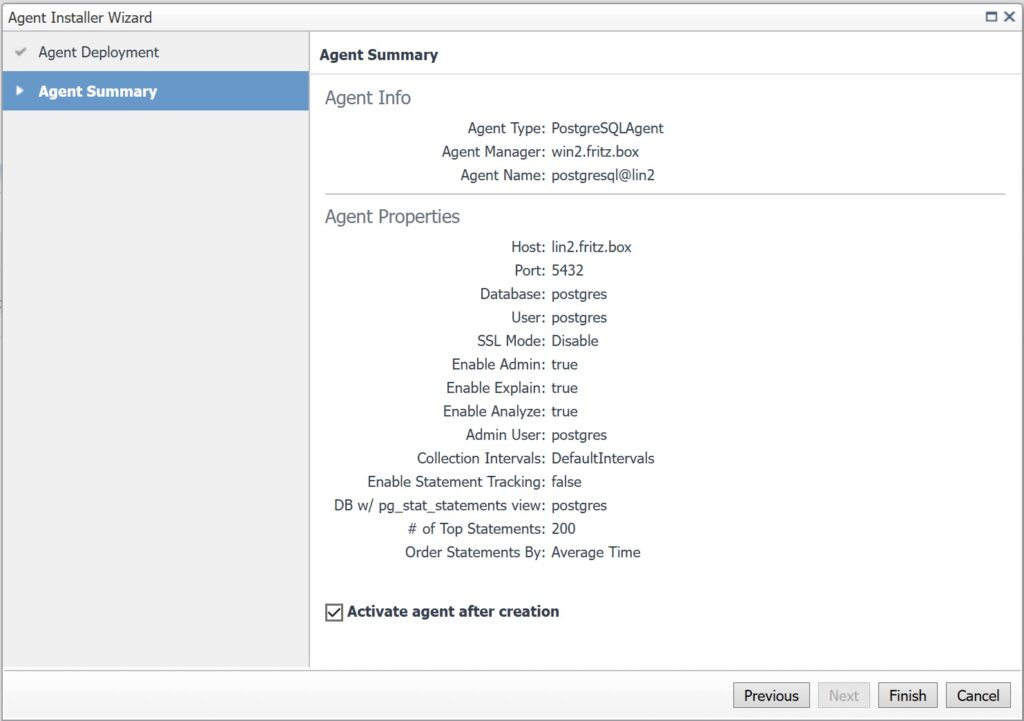
In the Foglight Dashboard we go to Databases, click on +Monitor and select PostgreSQL:
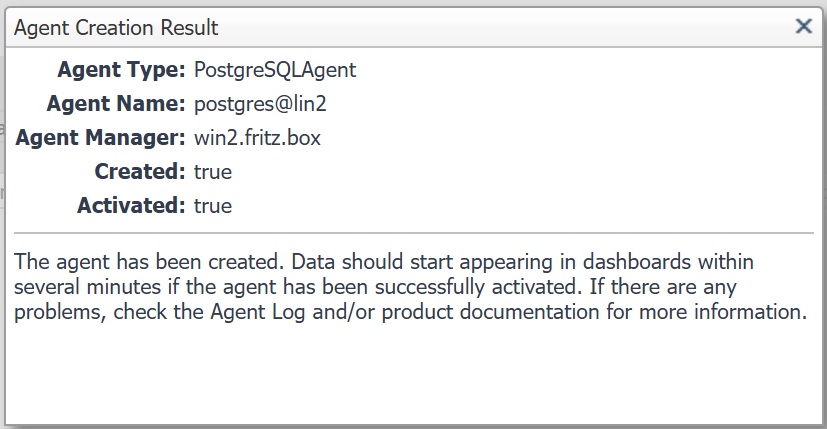
After some time the monitoring agent delivers monitoring data of the PostgreSQL Database:
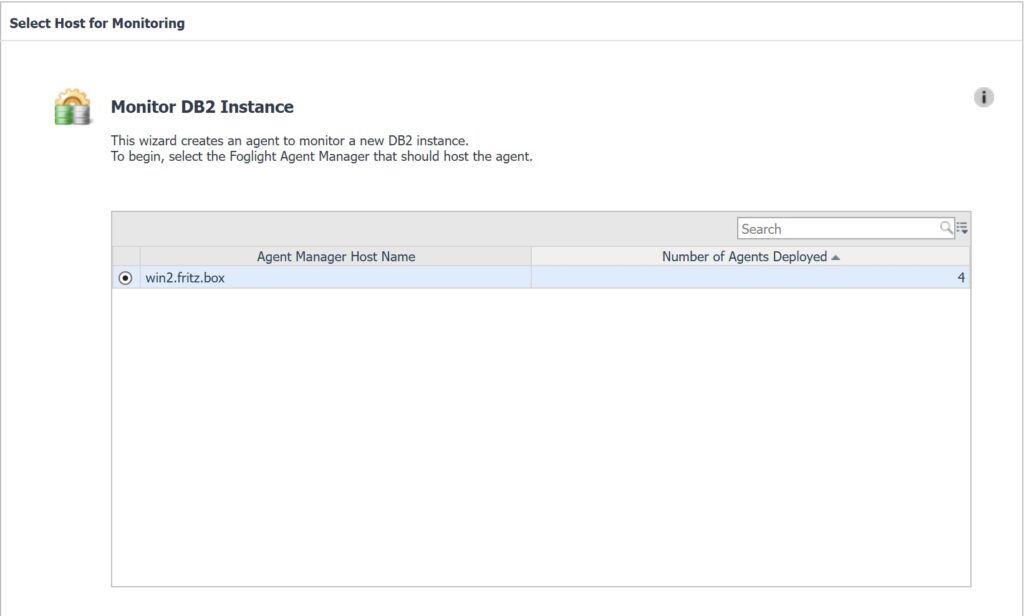
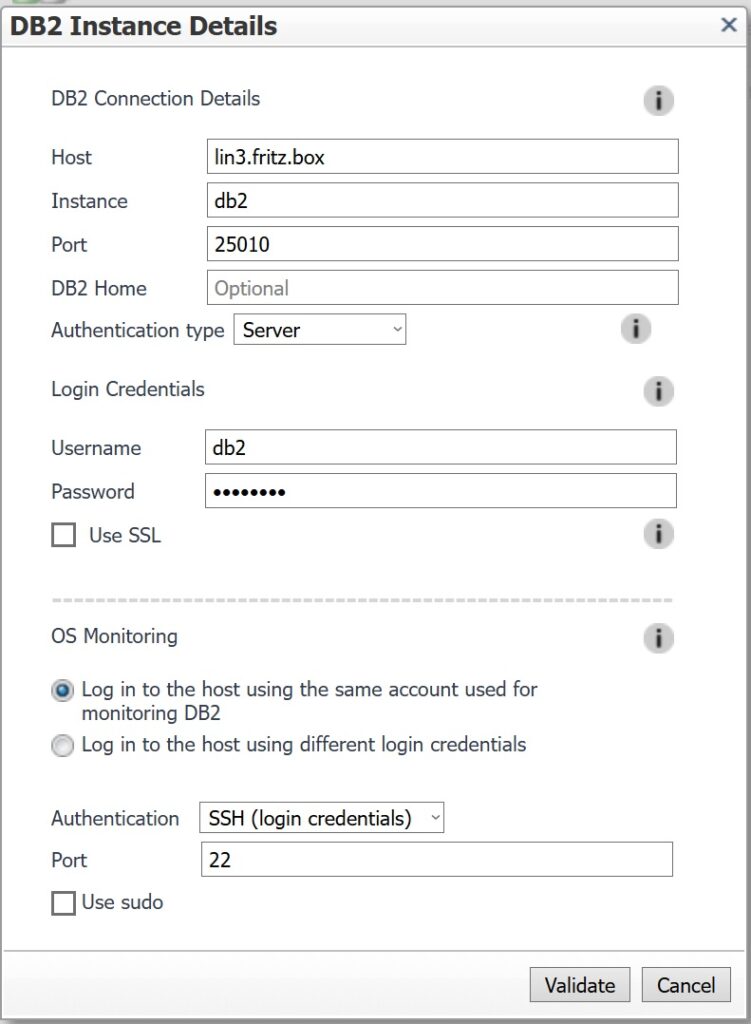
Monitoring of Db2 Databases
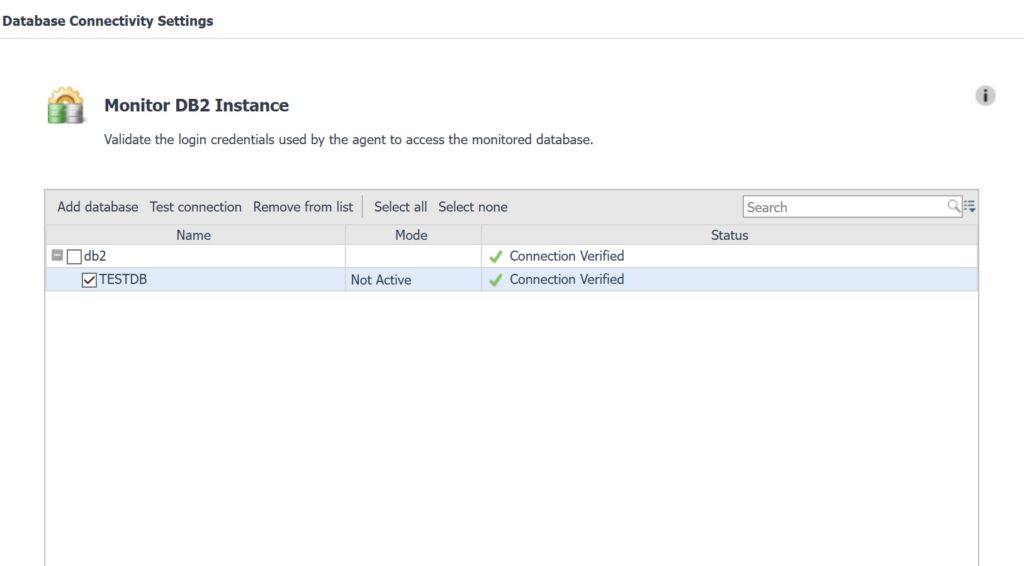
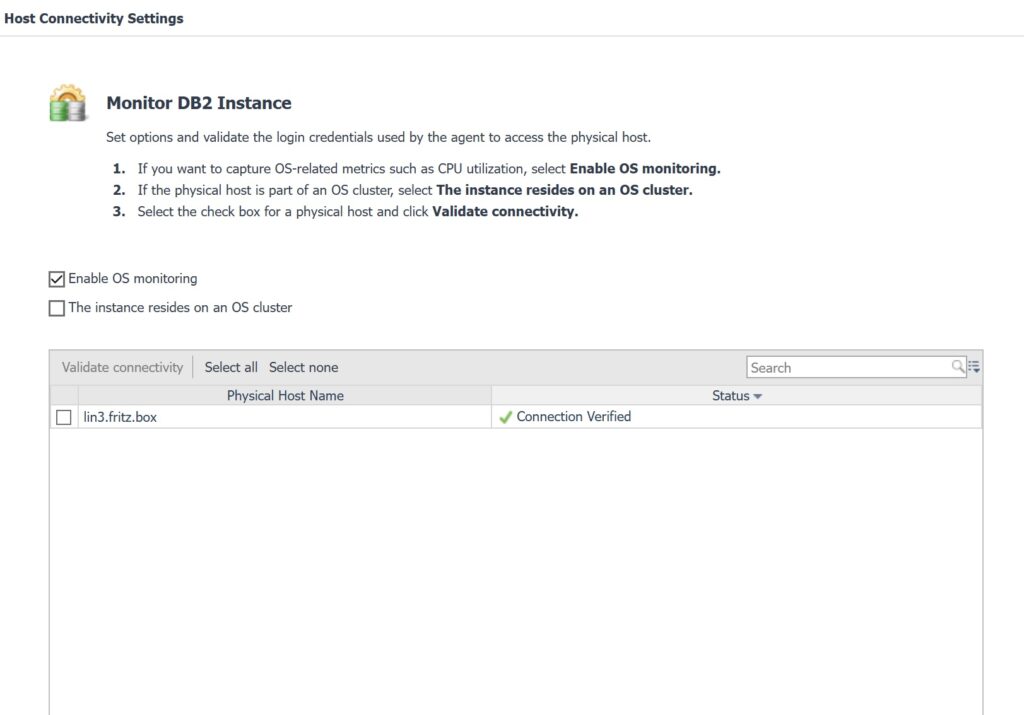
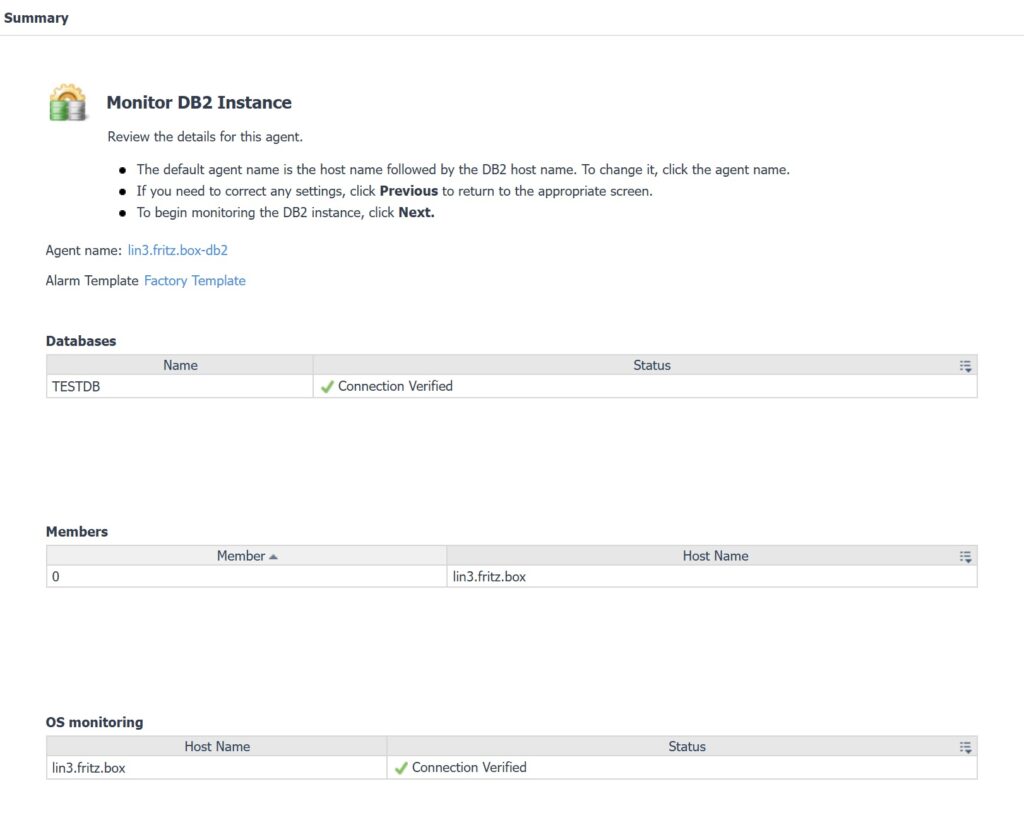
To monitor Db2 Databases with Foglight we need to get the port where the Db2 instance listens first (take a look here). Then we do the same as with the other databases. In the Foglight Dashboard we go to Databases, click on +Monitor and select DB2:
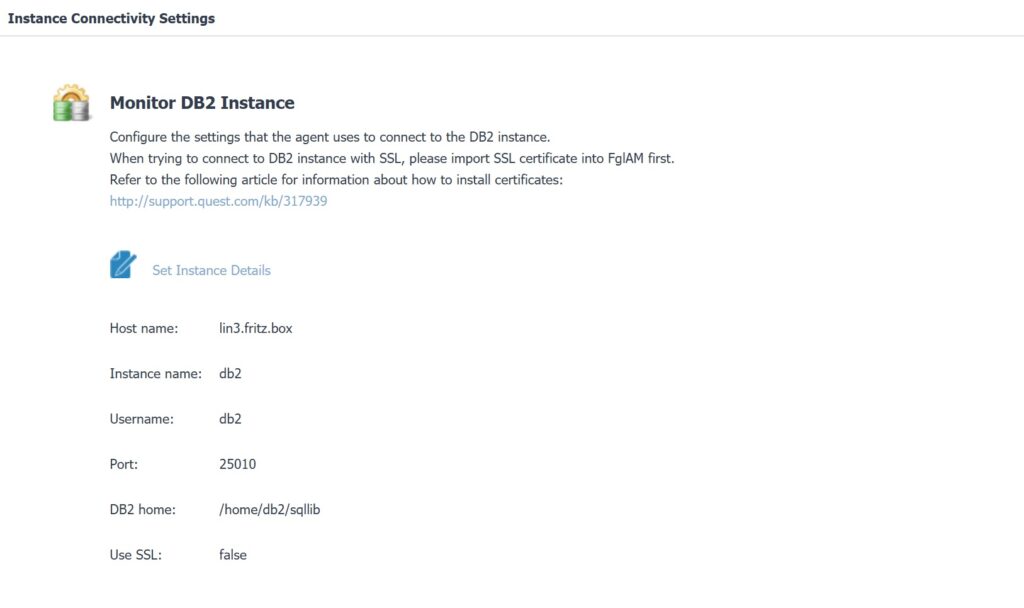
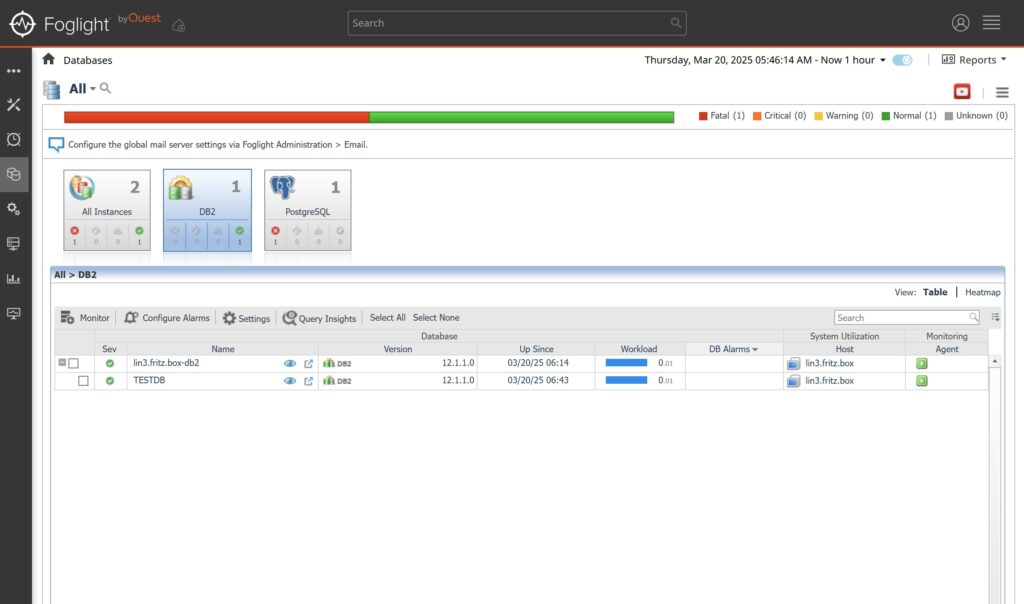
After some time the monitoring agent delivers its data:
Monitoring of SQL Server instances
First we need to enable WBEM to enable Windows Remote Management on the monitored host.
- Enable and start service: Windows Remote Management (WS-Management)
- Enable and start service: Remote Registry
- Add access permission for the Foglight server (11.1.1.183 in my case) in an Admin PowerShell:
winrm s winrm/config/client '@{TrustedHosts="11.1.1.183"}' - Run in an admin PowerShell:
winrm quickconfig -q - Adjust Windows Firewall in a Admin PowerShell run:
netsh advfirewall firewall set rule group="windows management instrumentation (wmi)" new enable=yes
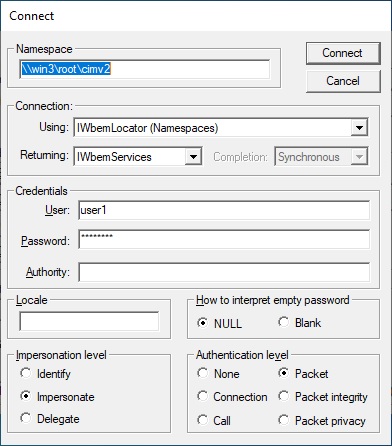
Windows Management Instrumentation (WMI) Tester
We can test the connection to the monitored system by running wbemtest.exe on the Foglight server and connecting to the monitored host (win3 in this example):
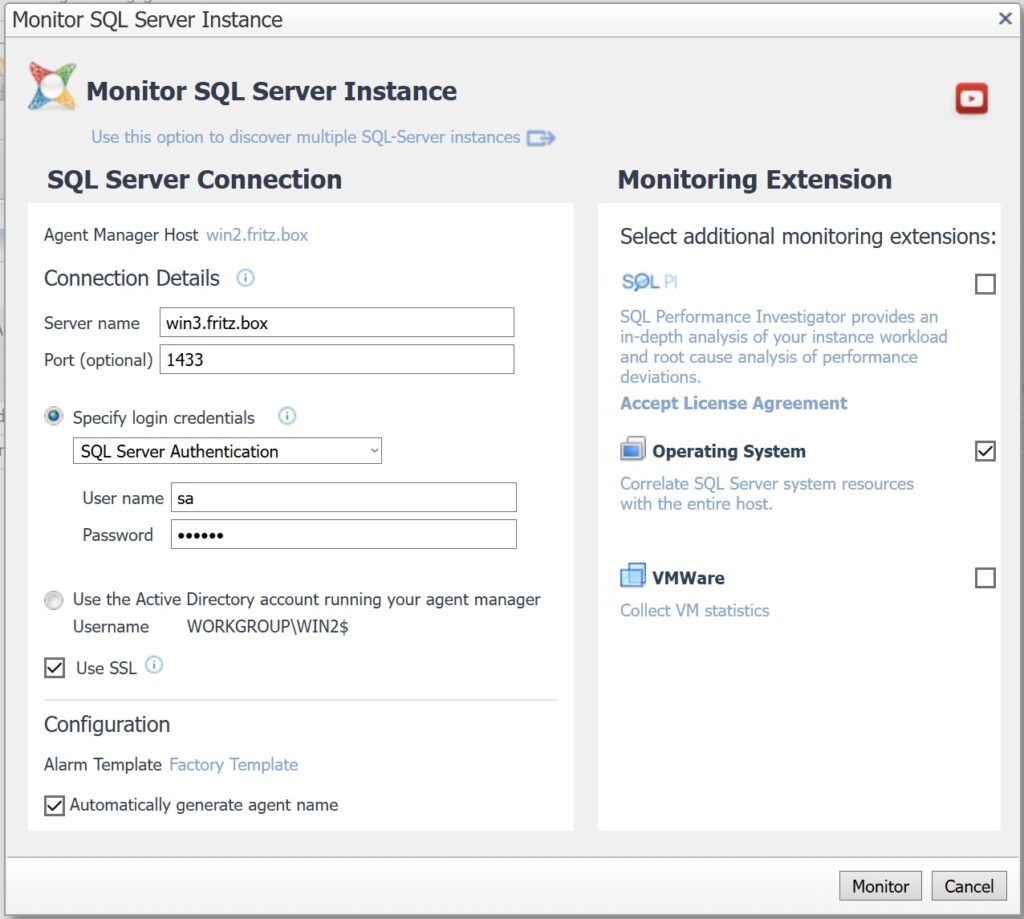
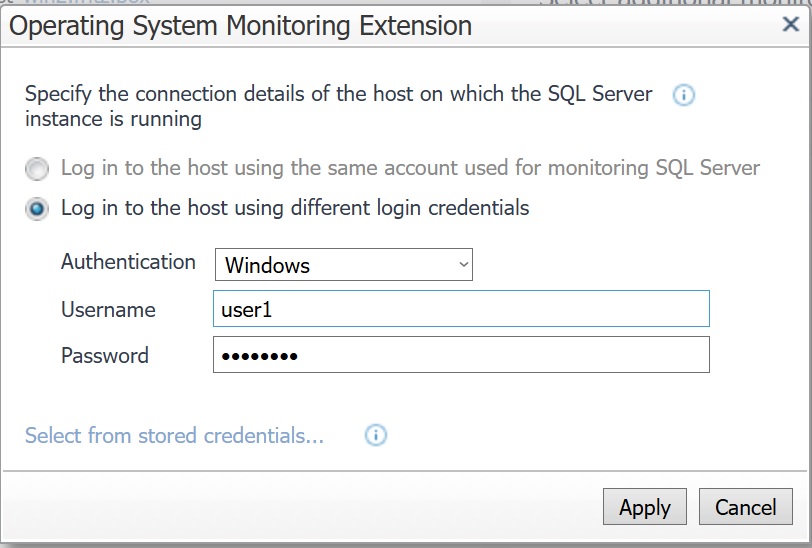
After this has been done we can add the SQL Server instance as usual. In the Foglight Dashboard we go to Databases, click on +Monitor and select SQL Server:
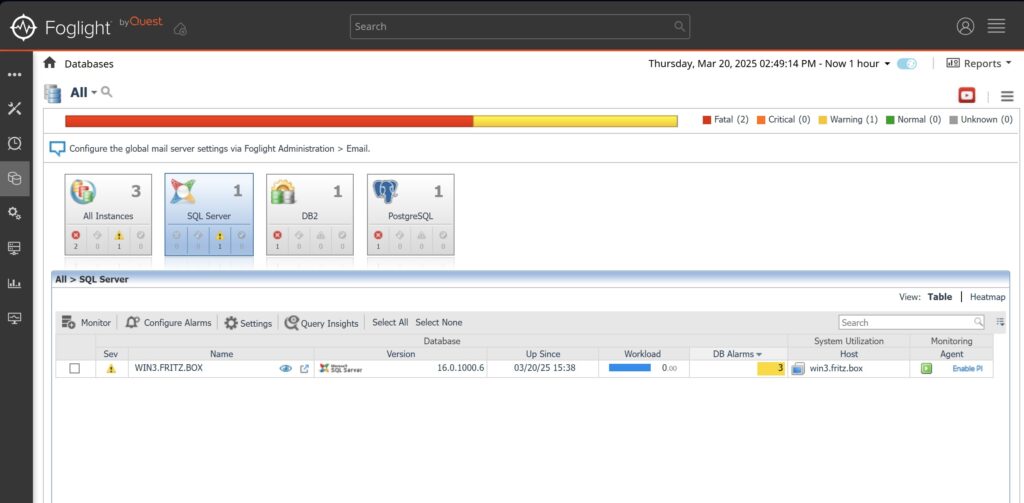
After some time we can see the first data coming from the SQL Server instance:
Leave a Reply